How to Generate Reports from Excel Data (3 Easy Methods)
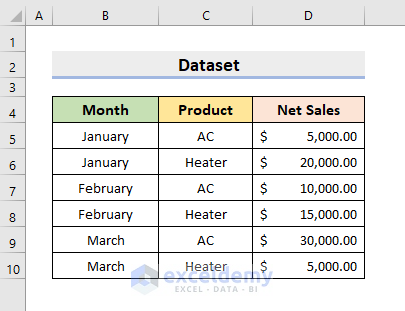
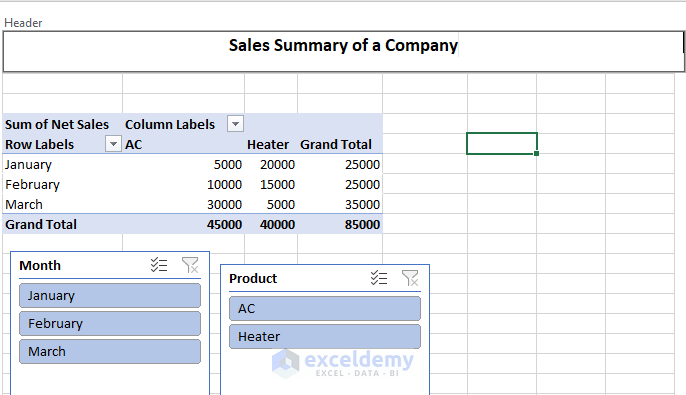
This sample dataset represents 3 Months (January – March), 2 Products (AC and Heater), and the Net Sales of a company. We’ll generate reports on the Sum of Net Sales by Month and also by Products.
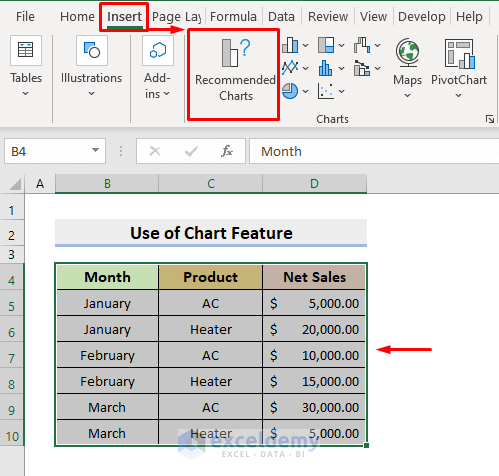
Method 1 – Inserting Chart to Generate Reports from Excel Data
- The Insert Chart dialog box will pop out.
- Select the required chart type from the left pane.
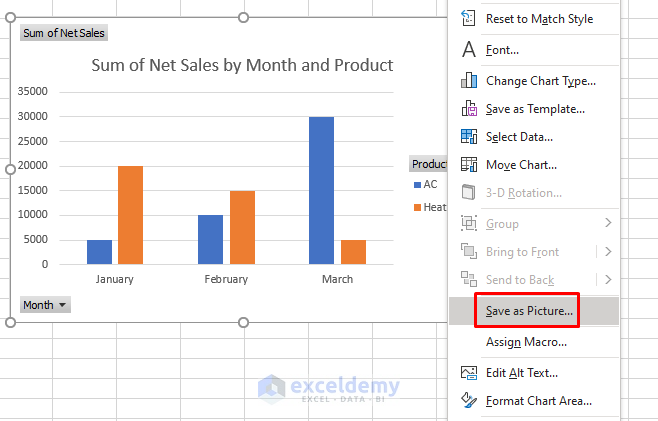
- In this example Clustered Column is selected. It will return a chart showing the Net Sales of each product in each month in 2 Different Colors.
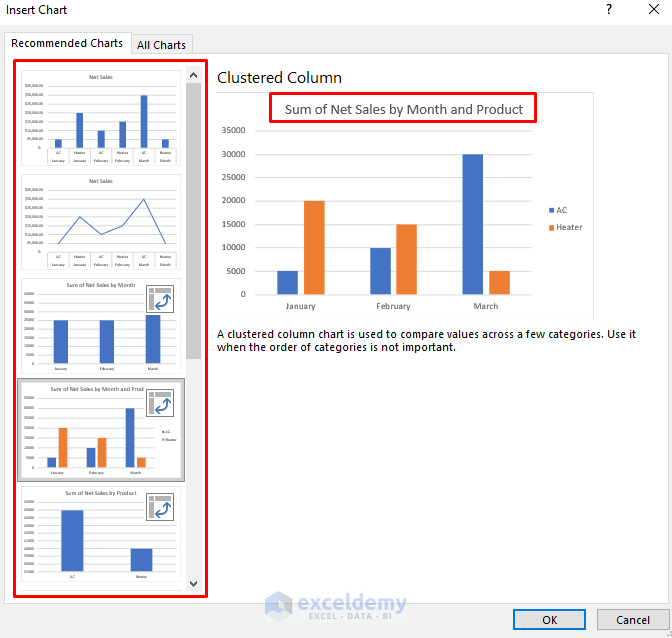
- Press OK.
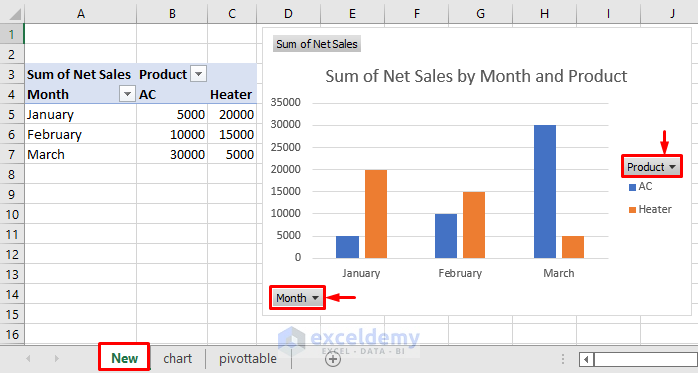
- The Month and Product drop-down icons allow the user to further sort the data as required.
- To save the chart as a picture, select the chart and right-click on the mouse.
- Choose Save as Picture.
Method 2 – Creating a Chart Manually
STEPS:
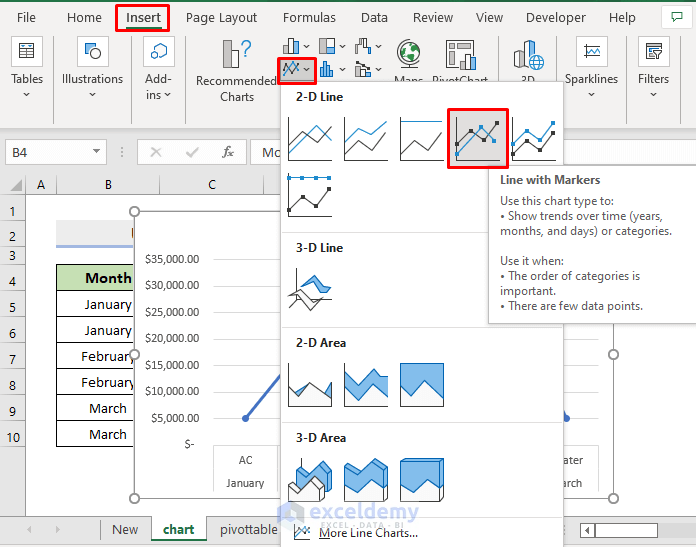
- Choose B4:C10 and select the Insert tab.
- Select the required chart type. In this example, the 2-D Line graph with Markers is selected.
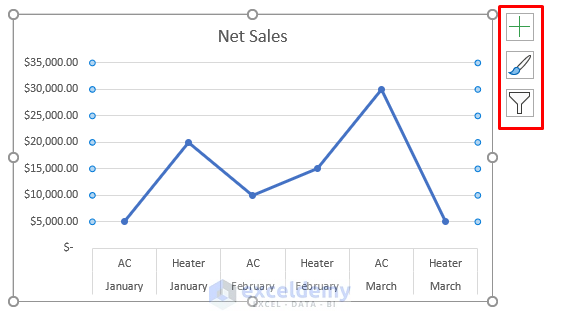
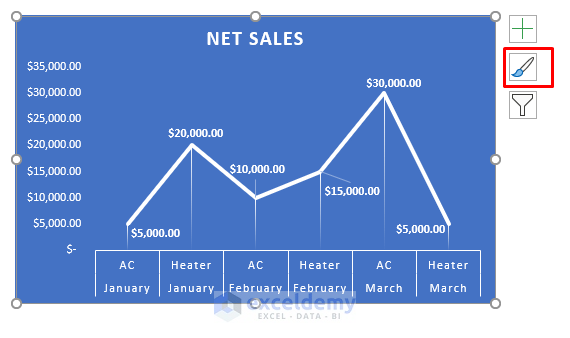
- The chart can be modified by using the 3 different icons shown in the red box on the right-hand side of the chart.
STEPS:
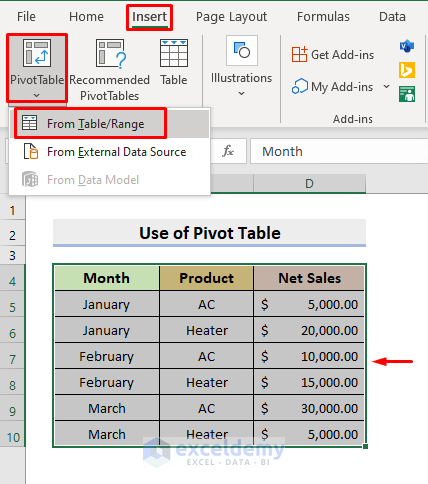
- Select B4:C10 at first.
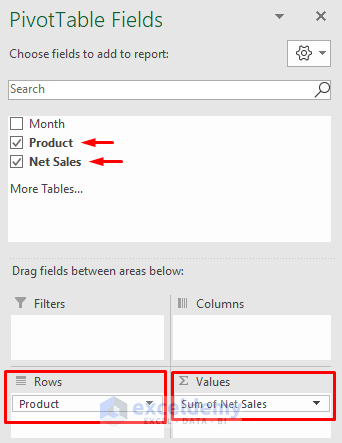
- Click the Insert tab and choose PivotTable ➤ From Table/Range.
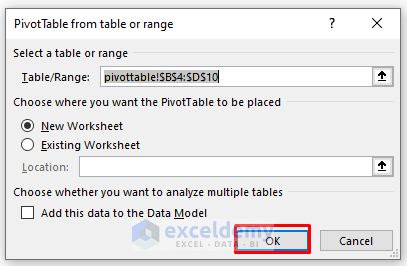
- A dialog box will appear, press OK.
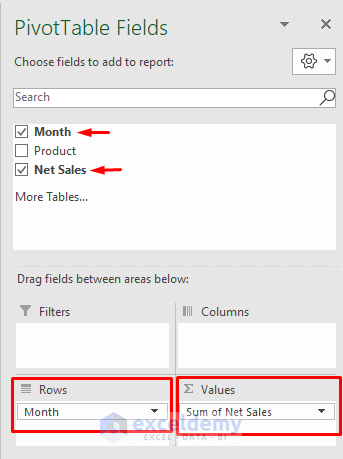
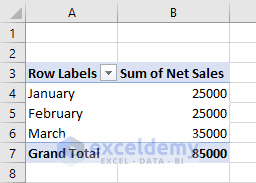
- This will return a report where the Sum of Net Sales is shown on the basis of Months.
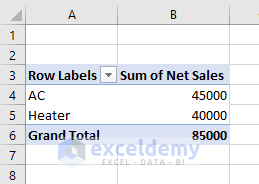
- Clear the checkmark for the Month and place the Product in the Rows section.
- This will return a report based on the products.
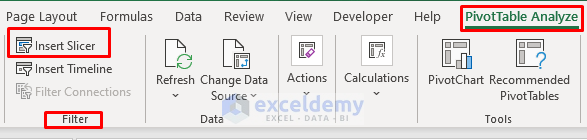
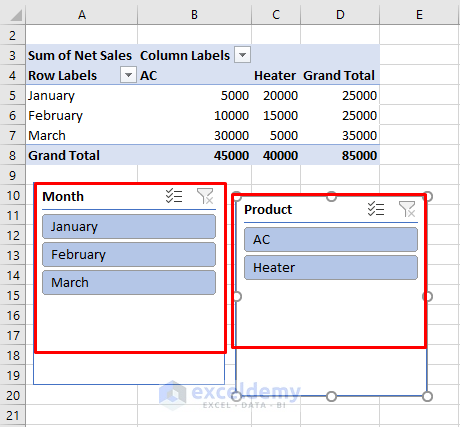
- The slicers allow the user to make changes to see their required results.
How to Print Reports Generated from Excel Data
STEPS:
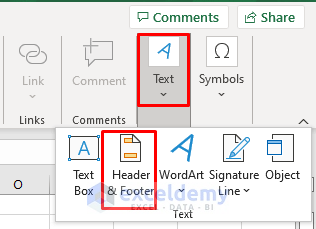
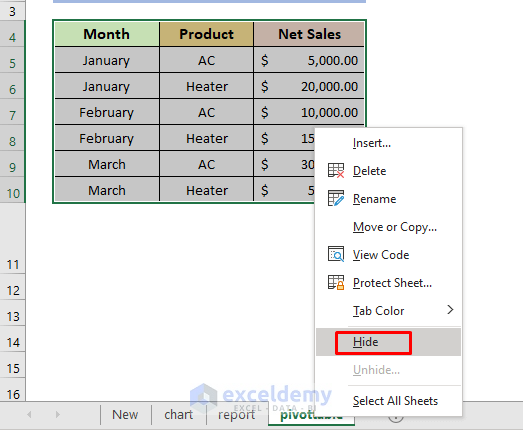
- Hide the sheets that you don’t want on the report.
- To do this, select the sheet and right-click on the mouse.
- Choose Hide.
- Go to the File tab.
- In the File window, select Print.
- Choose Print Entire Workbook, Landscape Orientation, Fit All Columns on One Page.
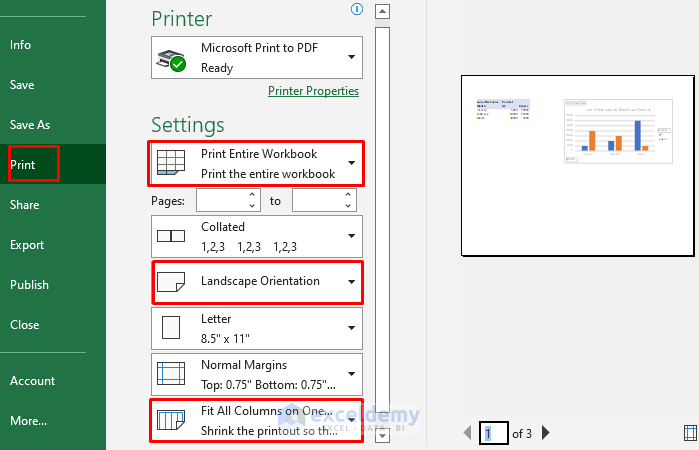
- Select Print and Excel will generate a PDF file of the report.
Download Practice Workbook
Download the following workbooks to practice by yourself.
